Back to Showcase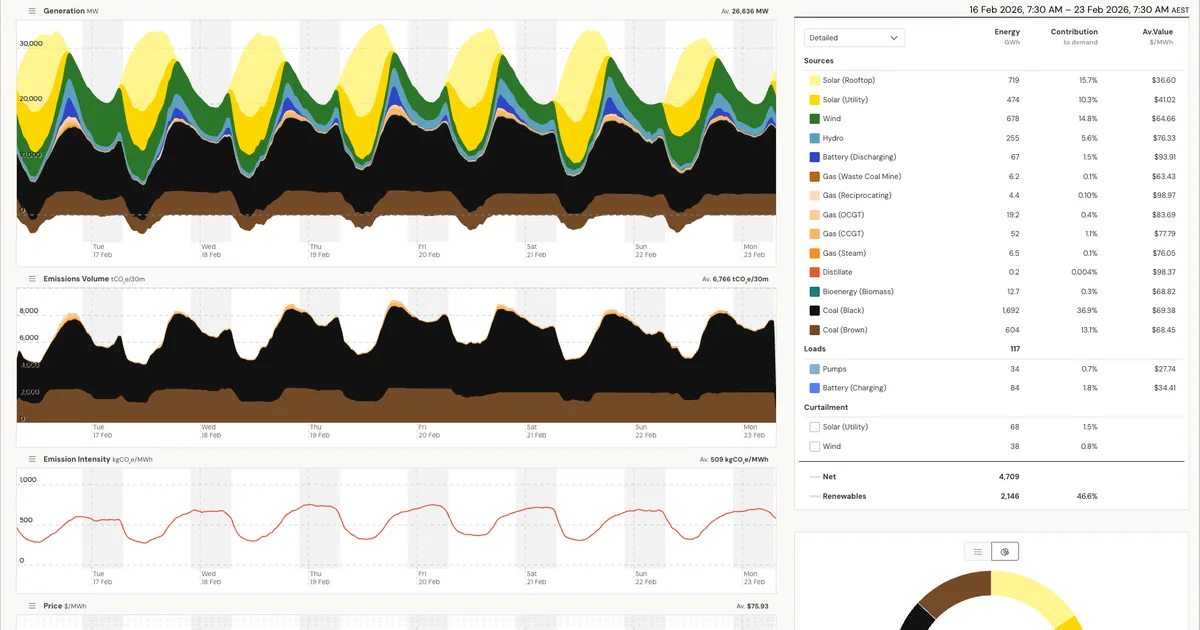
OpenElectricity.org.au
Open Electricity Live Dashboard
A real-time dashboard showing the Australian National Electricity Market generation mix, demand, and emissions intensity.
About the Project
The Open Electricity live dashboard is the reference implementation for the Open Electricity API. It provides a real-time view of the Australian National Electricity Market including:
- Current generation by fuel type (coal, gas, wind, solar, hydro)
- Grid demand and frequency
- Carbon emissions intensity (kg CO₂/MWh)
- State-by-state breakdowns for QLD, NSW, VIC, SA, and TAS
Technical Stack
The dashboard is built with Next.js and consumes the Open Electricity API. All data refreshes every 5 minutes to match AEMO's dispatch intervals.
Data Coverage
The dashboard covers all regions of the National Electricity Market (NEM) and displays both current conditions and 7-day historical trends.